SEO Testing
Measure the impact of your SEO changes
Understanding our test types
At metamanager, we offer three distinct types of SEO tests, each designed to analyze how changes made to your website affect its organic traffic from search engines.
Split Test vs. Time-based Testing
Split Test
Compares the performance of two separate groups of URLs during the same test period. Typically between a test group (group A) and control group (group B), where changes are only made on pages in Group A.
Time-based Test
Compares the performance of a single group of URLs during the test period, with the performance of the control period.
How much data you need for each test type
Each type is suitable for different scenarios. When we say “Scale”, we refer to the amount of pages and traffic data required to run a significant test.
Time-based TestBefore & After Analysis
Requirements:
- Single URL: Min 30 clicks / 100 impressions (30 days)
- Single group: Min 60 clicks / 200 impressions (30 days)
- Split Test: Min 100 clicks / 1,000 impressions (30 days)
How it works:
Compares performance before and after SEO changes by analyzing the difference between control period (before) and test period (after).
Benefits:
- Quick to set up and analyze results
- Works with smaller data sets
- Good for testing simple hypotheses
Best for:
Small to medium tests where you want to quickly validate SEO changes. Ideal for websites with moderate traffic.
Causal ImpactAdvanced Statistical Analysis
Requirements:
- Min 50-200 URLs (split between test/control groups)
- Min 1,000 clicks / 10,000 impressions (30 days)
- Requires historical data from 1-16 months
How it works:
Developed by Google, uses Bayesian structural time-series models to determine if changes actually caused shifts in performance by comparing expected results with actual outcomes.
Benefits:
- Most granular and accurate analysis method
- Accounts for seasonality and trends
- Provides statistical confidence levels
Best for:
Large-scale tests for high-traffic websites where statistical significance is critical. Best when you have substantial historical data available.
Split Test: Causal Impact Analysis
Causal impact analysis helps determine if changes - like website updates or marketing campaigns actually caused shifts in performance, by comparing expected results with actual outcomes over time.
It's the most granular and complex type of test offered at metamanager, originally built by Google to have an analysis framework to measure the "causal effect" from changes using Bayesian structural time-series models.
How to create a test:
To set up a causal impact split test, you need to:
- Select a group of urls
- Split them into two groups (Group A and Group B)
- Each group should be equal in traffic and amount of URLs
- Training data is added (the more the better)
- Implement your changes, then let it run for 21 to 28 days
Luckily, all these steps are done in minutes through metamanager.
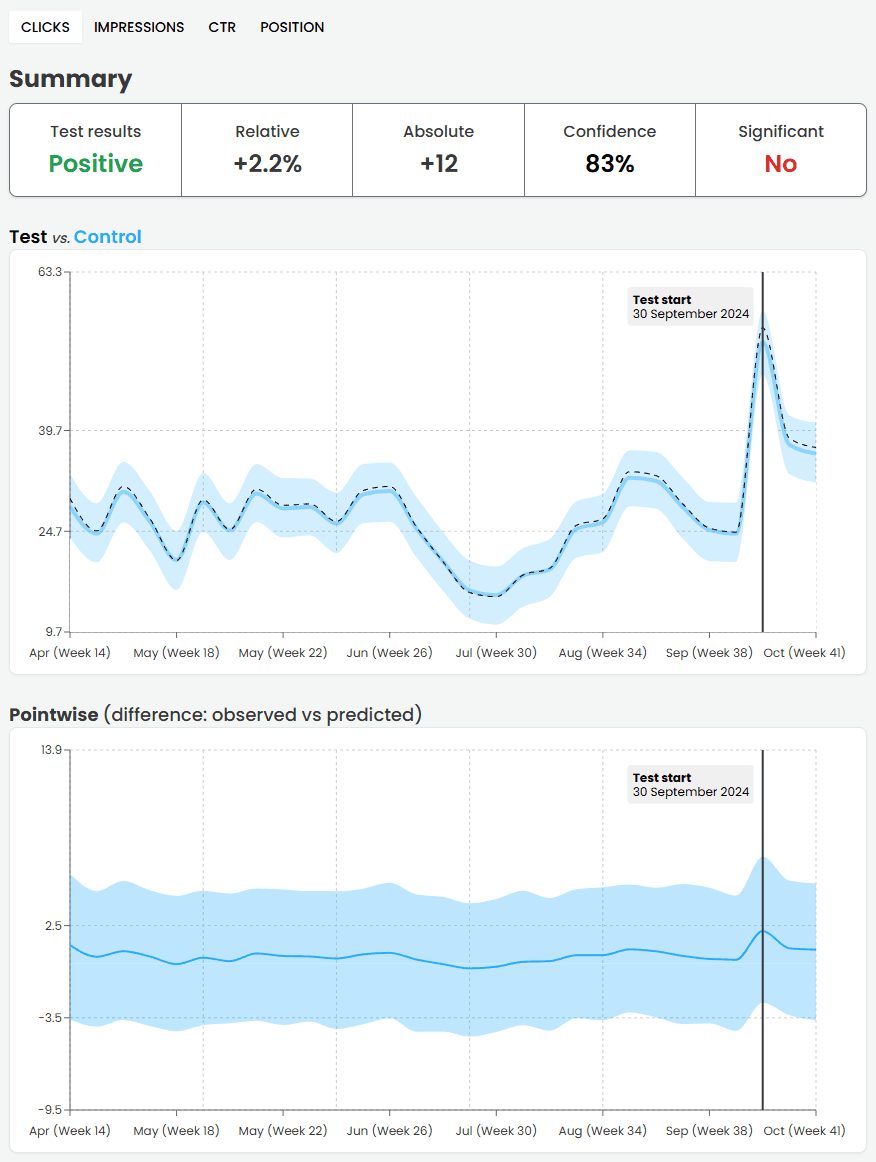
How to read the charts:
- Test vs Control: Compares the actual, observed performance (black) to the predicted performance (blue), with the control line using up to 16 months of training data to forecast expected behaviour.
- Pointwise: The difference between observed and predicted outcomes at each point.
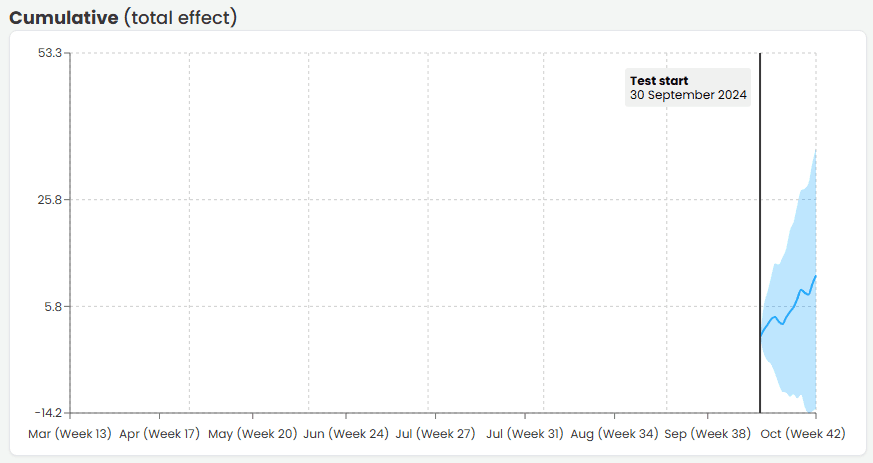
- Cumulative: The compounding difference, showing the "total effect" of changes, making it easier to judge test success.
The Cumulative is definitely the easiest chart see the effect:
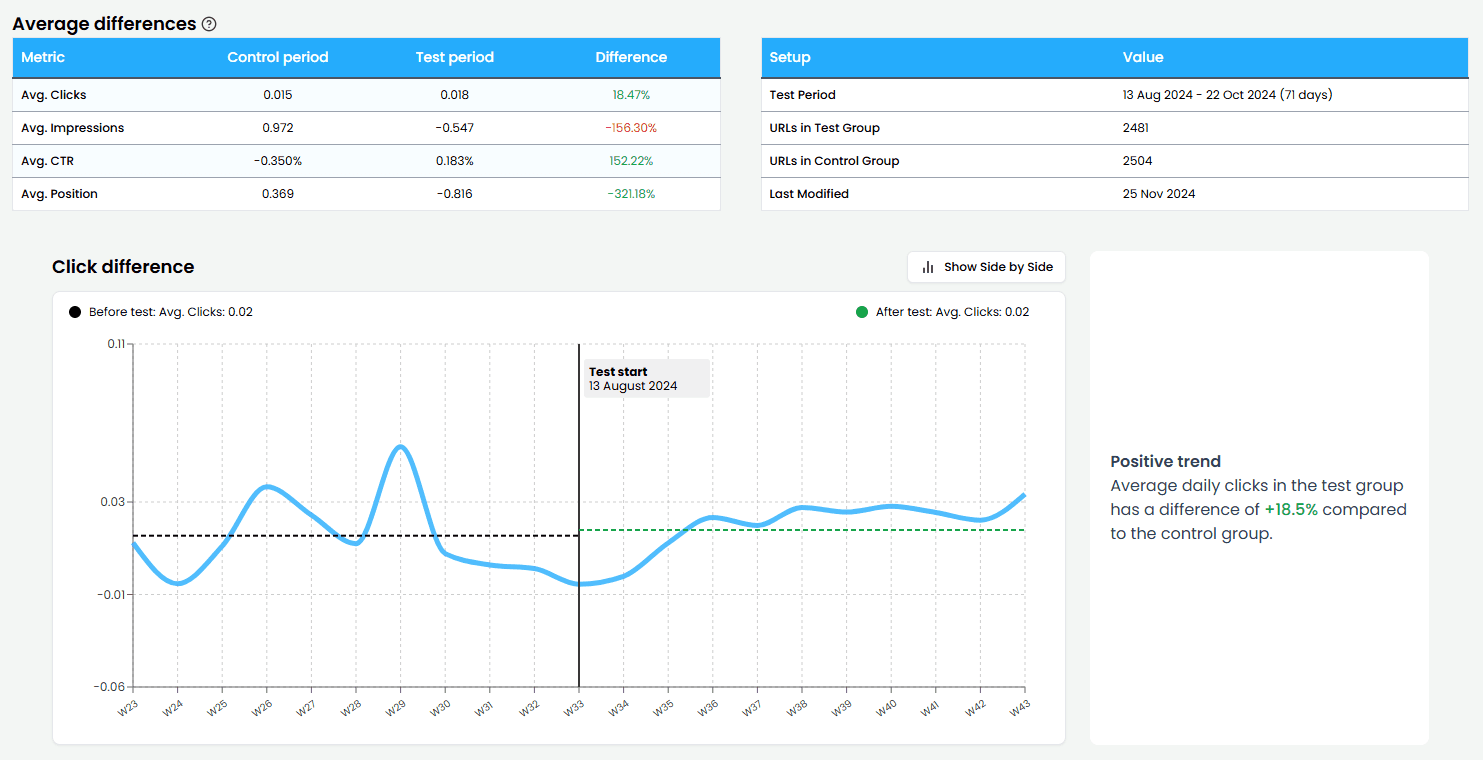
Split Test: Average Metrics Analysis
A split test using average metrics measures the % change in performance between a test and control group over different periods. It shows whether the gap between the groups grew or shrank after changes were implemented, providing a clear measure of impact.
How it works:
Daily metric differences (clicks, impressions, etc.) are calculated and compared between periods to determine if the changes had a positive or negative effect.
How to read the data:
- Average differences table: Shows the average metrics for a given period, then the difference between the test and control group. Green means the test group performed better.
- Metric difference chart: The graph is split into two parts, separated by the test date (Test start). The horizontal line in each period represents the average metric performance. Green indicates the test group performed better than the control group.
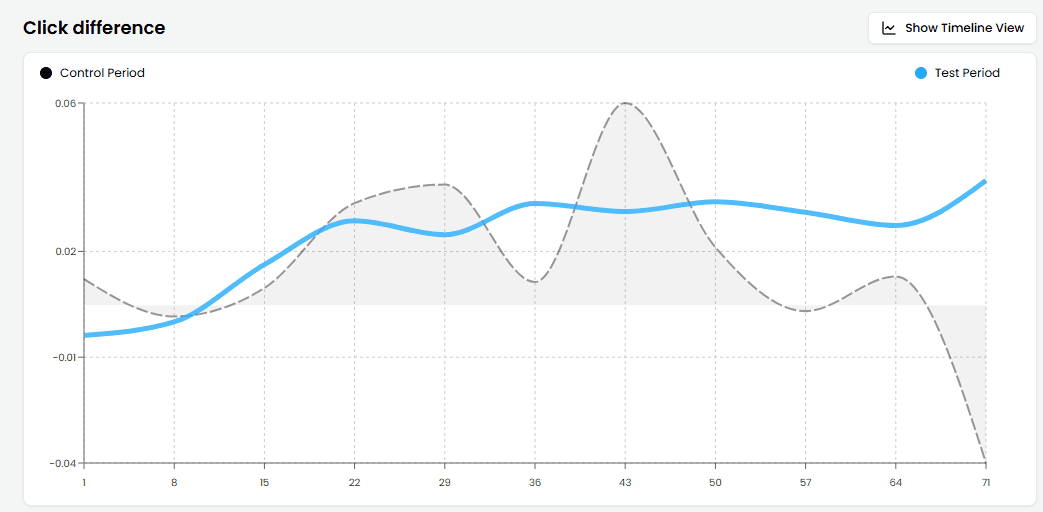
You can also click to the side-by-side chart:
Time-based: Average Metrics Analysis
Time-based analysis measures the % change in performance for a single group of URLs between a control period (before changes) and a test period (after changes). This method focuses only on the test group, making it ideal for smaller-scale tests with limited data.
How it works:
Metrics are compared before and after the test date (when changes were implemented). The % change indicates whether the changes had a positive or negative effect, with results adjusted for metric-specific interpretations.
How to read the charts:
The time-based tests use same charts as Split Test: Average Metrics Analysis, but interpreted differently:
- Average Metrics Table: Displays the metrics for each period and the percentage change. Green indicates improvement, while red highlights a decline.
- Difference Chart: Shows control period (before test date) and test period (after test date). Horizontal lines represent average metric performance in each period.
See Motetilbud — one of the cases where SEO testing was a success.